Cycle 1 Data


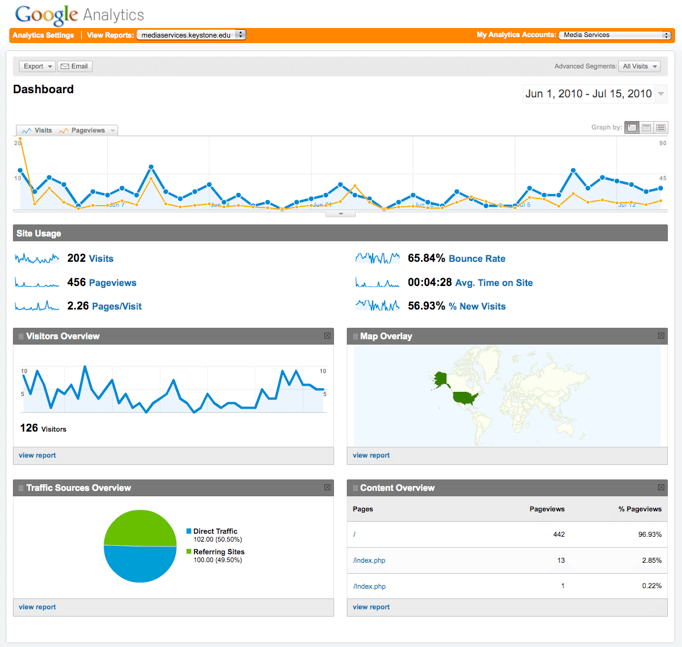
From the tracking system, we can see the website usage jump from one visit to 11 visits and 90 viewed pages on the day of the June 1st training. The very next day the website had 5 visits and 7 page views. On June 3rd, the second part of the training was held and the website reported 9 visits and 27 page views. For June 4th, the website received 7 visits and 9 viewed pages.
I received much similar data for the second week of the training. These sessions had four attendees and ran on June 8th and 10th. On the 8th there were 6 visits and 11 page views, segueing into 4 visits and 6 page views the following day. The second session on the 10th had 12 visits and 39 page views, dropping to 5 visits and 7 page views the next day.
Insight
The results of the tracking information shows increased usage of the website for several days after each scheduled live training session. The usage remains consistent throughout the month of June with the primary source of traffic coming from the Blackboard system. This means that the participants in the Blackboard trainings did return to the Media Services website to receive additional training. This was encouraging for my research, because it led me to believe that by making the tutorials available, they had become useful tools for reference.
Surprises
There were several items that I noticed needed improvement throughout the process. The first item would be the ability to track the views of the individual tutorials being watched. Currently, the data collected strictly pertains to visits to the homepage of the Media Services website. Due to the nature of the dynamic PHP web code used to create the site, the links are not static and therefore do not get tabulated with the tracking software. I have been experimenting with methods of being able to track the views of the individual tutorials, however as of yet have been unsuccessful.
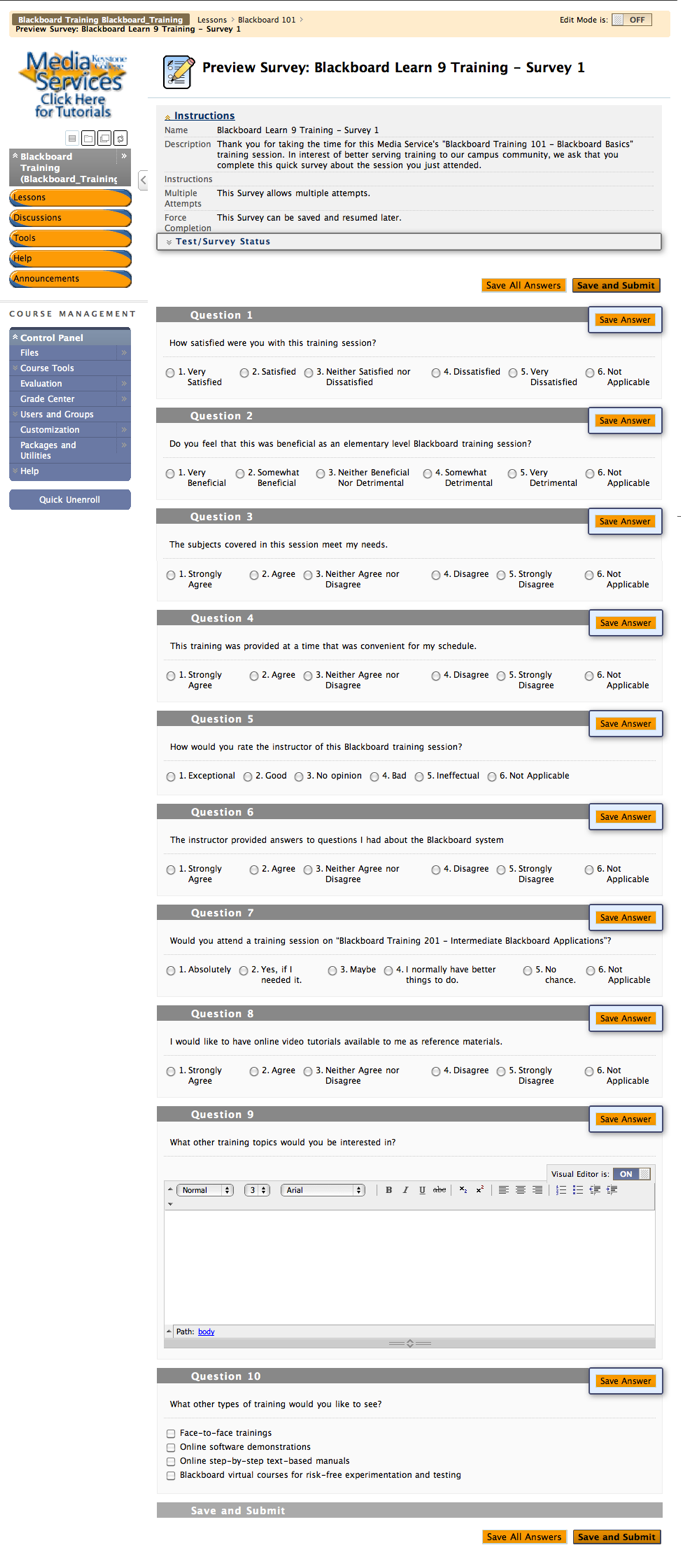
The participants of the Blackboard training program were asked to take a ten-question survey at the conclusion of the session. Below is a sample of the survey in Blackboard. I ran into several problems with the survey. The first issue was that most participants opted to not take the survey. Because this was such a relatively small group (8 participants), the amount of surveys completed did not yield enough feedback. The second issue was with regards to the Survey tool within the Blackboard system. When originally creating the survey in Blackboard, I failed to realize that surveys in Blackboard do not store answer information for the user. They are designed to be practice exams with no consequences. Therefore, none of the survey data was collected during this first cycle of research.


Data
The Keystone College Media Services training website was introduced to a group of nine faculty members as part of a two-week training exercise for our Blackboard LMS. The first training classes were delivered in two hour-long sessions on June 1st and 3rd. The first of these classes was designed for users whom had little to no experience with the Blackboard system. The second class taught more in-depth usage of the Blackboard system and built upon lessons from the first class. The first week of training had a group of five in attendance. The participants of the training enrolled in a virtual classroom in Blackboard and were asked to complete the lessons there. The lessons linked them to the appropriate video training on specific topics relating to the use of Blackboard. At the completion of each lesson the participants were asked to complete a ten-question satisfaction survey.
The Media Services website’s traffic was monitored throughout this cycle of the research using Google Analytics. This program is able to provide extensive information about the amount of traffic to the site, where the traffic originated from, and how long the users visited the site. Below is a sample page from the Google Analytics Dashboard. This displays the usage of the Media Services website from the date of the first Blackboard training session on June 1st, 2010, through July 15th, 2010.
Eric Slacktish
After reading through your information about Cycle 1, I was impressed with the sustained increase in traffic. This is clearly demonstrating that your training is having a positive effect on the effectiveness of your website. However, it is unfortunate that your initial survey data was not retained. Having that information would have been useful in further increasing the effectiveness of your training, as you would have been able to better tailor your training to the end-users' needs. In the future, I am confident that you will be able to use the survey data to make adjustments to your training, so that you may continue to improve your website's effectiveness.


Where do I go from here?
For the next cycle of research I will hold another set of Blackboard training sessions for instructors utilizing the Media Services website. I hope to gain a higher interest in the session by promoting it on our daily campus-wide newsletter one-month in advance. For future research, I will be using an evaluation designed in Google Docs, found here: http://sites.google.com/site/blackboardtrainingeval/
I think that the survey data is very important for this study to know if the learners feel that this system meets their support needs. I may conduct the next series of trainings a bit differently by incorporating an introduction to the basic components of the system and then let the learners seek out the trainings that they need from the tutorial site. I will be able to tell from the data I receive in the next cycle if this engages learners in a more effective manner.


